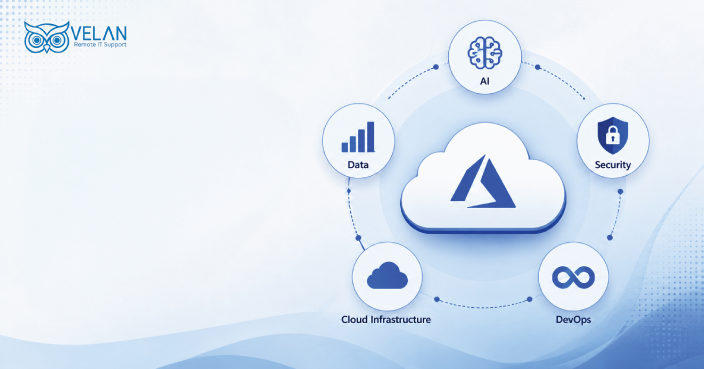
Observability vs Monitoring in Cloud Infrastructure Trends
Observability vs Monitoring in RIMS 2026 Trends
What is the difference between observability and monitoring?
What you know vs. What you can discover
Monitoring OR finding out, ‘Is something wrong?’
Monitoring focuses on tracking predefined or already listed metrics and setting up alerts for known issues. It actually helps teams detect any issues in your entire IT system quickly. For example, in monitoring, we set an alert for resource usage crossing a certain limit, facilitating a quick remedial action.
Observability OR finding out ‘Why something is wrong and what is happening inside?’
Observability enables a deeper understanding of system behavior. It combines metrics, logs, and traces to help technical teams identify unknown issues and investigate problems in detail till they find the root cause.
Why is observability better than monitoring in 2026?
Closely related, but serves different purposes
Observability is considered better than monitoring because systems have become more complex with cloud environments and microservices.
Even though traditional monitoring helps track familiar issues, it often falls short when unexpected problems arise. But observability supports a more proactive approach to understanding system behavior and fixing it before users are affected.
Overall, observability enables faster troubleshooting and improved reliability, making it more suitable for modern digital environments.
How does AI improve infrastructure observability?
Intelligent observability decodes complex issues in your IT system
AI has become the transformative element in managing and monitoring Remote IT Systems. It changes reactive monitoring into proactive and intelligent insights. AI itself has become the solution for the advanced observability demands of the AI-energized modern and complex IT environments.
Let us see how AI helps improve observability
Anomaly Detection
AI makes it much easier to spot problems by quickly analyzing large amounts of system data and noticing subtle deviations. In traditional systems, alerts are triggered only when certain or predefined limits are crossed. But AI doesn’t rely on fixed limits. It learns for itself what “normal” looks like over time and can detect even small changes that might go unnoticed.
It can catch unusual spikes in cloud usage, which may result in a high cloud bill or subtle changes in user behavior that may signal a problem early on. This means irregularities can be identified much faster to respond quickly and reduce outages.
Predictive maintenance and analytics
AI can help predict problems and take preventive measures before they happen. It looks at patterns in system data to guess when something might go wrong or when performance is slowing down.
Smart systems learn from how resources are used normally and warn teams in advance when some anomalies happen. This gives them enough time to act before any issues occur.
More advanced AI-driven systems can even predict when an ML model needs retraining or anticipate network congestion during peak periods.
Best observability tools for remote infrastructure
Here is a list of some top IT infrastructure observability tools in the market.
Datadog
A top SaaS-based platform for cloud monitoring. It offers unified dashboards and AI-powered insights. Ideal choice for distributed remote teams.
Dynatrace
Tailored platform offering full-stack enterprise observability. It is suitable for hybrid-cloud environments with automated root-cause analysis.
Grafana Labs (Prometheus with Grafana)
This is the favorite set of tools for teams that need detailed metrics and flexible dashboards. Specifically used in Kubernetes-based environments.
New Relic
Compatible with Docker and StatsD. Delivers strong application performance monitoring with a comprehensive suite for cloud-native teams.
Splunk Observability Cloud
An apt choice for log-heavy environments. Provides monitoring in real-time and high-volume data analytics
Honeycomb:
Specialized in high-cardinality data. Teams can explore and understand difficult, unpredictable service behaviors, generally better than metrics-driven tools.
Coralogix
Presented with a unified threat intelligence feature. Facilitates the detection of harmful network activities and exposes various threat entities.
LogicMonitor
Built for managed service providers handling multi-tenant or multi-site environments. Covers on-premises and cloud environments.
What are the three pillars of observability?
The “What Happened”, The “Is Something Wrong?” The “Where is the Issue?”
Together, these 3 entities make developers and IT teams understand the internal status of a distributed system. Beyond basic monitoring, they help to determine why a failure occurred by providing comprehensive context.
The three pillars of observability are
Logs: These are detailed, timestamped records of events that happen in a system. They show exactly what happened, like errors or specific actions.
Metrics: The numbers or the counts tracked over time, like CPU usage, memory, or error rates. They give an overview of system health and help trigger alerts.
3 types of metrics: Gauge metrics, delta metrics, and cumulative metrics.
Traces: Show the path of a request as it moves through different parts of a system. They help find where exactly a problem or slowdown is happening.
Is observability replacing traditional monitoring?
Not competitors, but co-existing partners
Observability definitely is not replacing monitoring. It is the expansion of monitoring.
Monitoring is essential for tracking system integrity and ensuring services are up and running. Without monitoring, there would be no data to observe.
Analyzing the signals provided by the monitoring system, observability tools deliver the insights to reach a solution. Together, they create a complete approach to managing modern systems more effectively.
A simple comparison between observability and monitoring
| Feature | Traditional Monitoring | Observability |
|---|---|---|
| Primary Goal | Alert on symptoms | Root cause analysis |
| Approach | Reactive | Proactive |
| Data Types | Metrics, simple logs | Metrics, Logs, Traces |
| System View | Component-level | Distributed, holistic |
| Question Type | Known-knowns | Unknown-unknowns |
| Troubleshooting | High manual effort | Automated analysis/contextual links |
| Best For | Static, monolithic infrastructure | Dynamic, microservices, cloud-native |
Leverage the synergy between monitoring and observability
The control and the clarity
Depending on monitoring alone is no longer enough when your systems have spread across different environments, like on-prem and cloud. Monitoring helps you by providing real-time alerts and system status, but observability gives you even deeper knowledge to analyze and fix issues effectively.
These two are not in competition—they work better together. When used side by side, they help IT teams build strong and reliable systems.
If you would like to know how observability can improve your IT setup, feel free to reach out at [email protected].
Frequently Asked Questions and Answers on Observability & Monitoring
Observability and monitoring are very closely connected. They both focus on giving clear insights into system performance, stability, and behavior. They collect and analyze data, then present to help teams spot and resolve issues.
Monitoring and observability team up to manage IT systems effectively. Monitoring tracks metrics and sends alerts when issues occur. Whereas observability analyzes data to find root causes. Also, observability improves monitoring through feedback and AI insights. Both together enhances proactive issue prevention and deliver reliable and high-performing systems.
Yes. It is technically possible to implement observability without monitoring. Yet, it is not a practical approach. Monitoring generates alerts that signal when issues require attention. Without it, organizations may lack timely awareness of problems.
For optimal results, both should be used together. Monitoring identifies and flags issues, while observability provides the deeper insights needed to investigate and resolve them effectively.
Metrics collection is the starting point. Tools capture numerical data over time—such as request volumes, memory usage, disk activity, and network traffic—to show how a system is performing.
Alert rules highlight issues that need attention. For example, when disk space is low or database connections are fully used, alerts are sent to the team.
Dashboards display this data visually. They help teams quickly identify trends, making it easier to manage incidents and plan for future capacity.
Categories
- Azure 02
- AWS 04
- Remote IT Support 03
- Cloud Security 01
- Cloud Services 02
- Managed IT Services 03